Contract Efficiency Analysis
In today’s game, players are being paid millions of dollars, and payroll decisions play a massive role in whether a team can consistently compete. The goal of this project was to look beyond raw salary totals and answer a simpler but more important question: how much does each win actually cost? By using WAR as a measure of on-field value and comparing it to player and team salary, this analysis identifies the most efficient contracts across the league at the player, team, and positional level.
Rather than focusing on just who spends the most, this project focuses on who spends the smartest.

Information
This chart shows every MLB player once, mapped by their 2025 salary on the x-axis and their projected WAR on the y-axis. Each dot is a single player, and the colors represent their primary positions.
The dashed horizontal line represents the league-average WAR, and the dashed vertical line shows the league-average salary. Together, they split the league into four clear groups—high value, low value, overpaid, and underpaid.
A great example is Cal Raleigh, who sits well above the league-average WAR line while still on a very low salary. That makes him one of the most underpaid and high-value players heading into 2025. On the other end, players like Aaron Judge, Juan Soto, and Shohei Ohtani are in the top-right quadrant: elite performance, elite salary. Pitchers like Zack Wheeler and Jacob deGrom also highlight how expensive some high-WAR pitching can be.
Overall, this plot helps visualize:
-
Who is outperforming their contract
-
Who is getting paid like a star and producing like one
-
And which players or teams might be carrying inefficient deals
This makes it easy to see the landscape of value vs. spending at a glance.

Colorado stood out as a clear outlier in this analysis due to an extremely low team WAR compared to the rest of the league, which resulted in an abnormally high $/WAR. Because their value was so far outside the normal range, including them compressed the scale and made it harder to fairly compare the rest of the teams. For clarity and better league-wide comparison, Colorado was removed from the final visualization.

This chart shows team-level contract efficiency for the 2025 season, comparing total team WAR on the x-axis with dollars per WAR on the y-axis (lower is better). Each dot represents one team. The dashed vertical line marks the league-average team WAR, and the dashed horizontal line marks the league-average $/WAR, dividing teams into clear value tiers.
After excluding Colorado as an extreme outlier, clear tiers of team contract efficiency emerge. Tampa Bay, Miami, Milwaukee, and Cleveland stand out as some of the most efficient teams, producing strong team WAR at a relatively low cost per win. These clubs are getting the most value out of their rosters.
On the other end, teams like the Angels, Mets, and Rangers rank among the least efficient, paying a much higher cost per WAR relative to their production. High-spending teams such as the Yankees and Dodgers fall closer to the league average—solid production, but at a premium price.
Overall, this shows that winning efficiency is not driven by payroll alone. Teams that consistently develop talent and extract surplus value from contracts gain a major competitive advantage in roster construction.
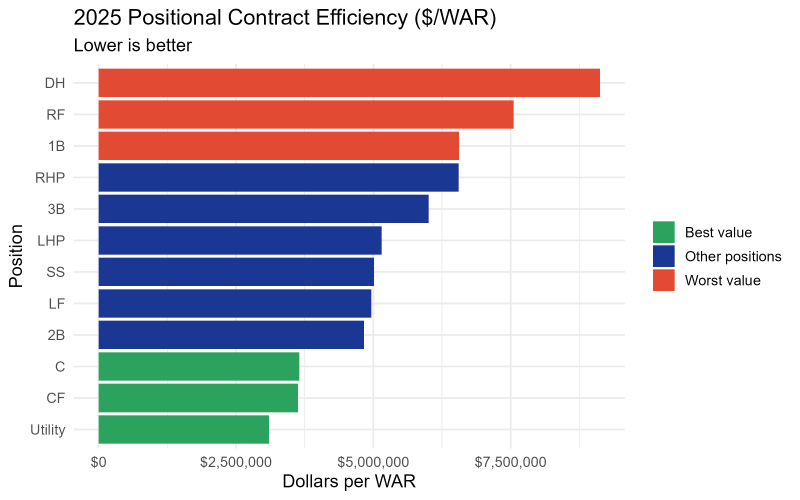
This chart shows contract efficiency by position for the 2025 season, measured in dollars per WAR ($/WAR), where lower is better value. Each bar represents the average cost of one win at that position across the league, with green highlighting the most cost-efficient positions and red showing where teams are paying the biggest premium. One of the biggest takeaways is the value of utility players—despite often being signed as low-cost free agents, they provide strong WAR at a fraction of the cost of premium positions. Their defensive versatility and everyday flexibility allow teams to gain real production without tying up payroll, proving that smart, low-cost depth can have a major impact on overall roster efficiency and team success.

This chart highlights the top 20 most efficient contracts in 2025, ranked by dollars per WAR ($/WAR), with the dashed line representing the league median. Every player shown here is outperforming the median value benchmark, meaning their teams are getting more production per dollar than the league average.
A key takeaway is that most of these players are rookies or early-career players still under team control. Because they are on pre-arbitration or early arbitration contracts, their salaries are low relative to their on-field impact, which naturally creates extreme surplus value.
Create Your Own Website With Webador